
- Benchmark ASINB09DKPYXWH
- MarketplaceUS
- Category ID3610841
- Analyzed Products
- Keywordbedside caddy, bunk bed caddy, bedside storage bag
- Price Range-
- Minimum Net Profit Margin10.00%
- MOQ100
- Est. Purchasing Cost¥7.78estimated
- Data Date2026-07-31
- Your Budget (for new listing) (CNY)¥500,000.00
Report summary from Keble AI Agent: Listing
这个市场不该进,已经是明显的价格战市场,不适合大品牌或小商家。 现有数据里,新发布产品的盈利率是0%,16个新发布里没有一个跑出可验证盈利;同时利润主要卡在低位,0%~10%和负利润样本已经占到新入场里的全部可见结果,说明新入场基本都在亏。新品牌也没有形成可复制的成功路径,Lifewit 和 Fab totes 这两个新品牌共8个新产品,全部不盈利。
Recommended Products Features Direction

These products have successfully captured market share and are profitable. Their design and features are suggested for your investment, based on market competition, saturation, and demand.
New Brands
VS
Old Brands
Green indicates better success rate, red indicates poorer success rate. If you are a new brand, focus on the left side; if you are an old brand, focus on the right side.
New Brands
Old Brands
#Budget Requirement
Listing这个市场不该进。它已经进入明显的价格战/饱和状态:新品牌新品里没有可验证的盈利案例,整体可盈利产品只占21.43%,而新发布产品的盈利率是0%,说明新入场基本都在亏。 你的50万人民币足够做单个ASIN的前期起步,但不够把你从这类竞争里安全送到长期盈利;如果没有明显差异化、品牌力和额外预算,进场大概率会被低价和投放成本拖死。
证据很直接:Lifewit 作为新入场品牌,5个新品里0个盈利;Fab totes 作为新入场品牌,3个新品里0个盈利,且其新品里有明显负利润样本,像 B0GWQMDLLR 只有3.74%利润率、B0GWQMN92J 是-4.55%。这不是“轻微波动”,而是新品牌集体失速。相反,老品牌 Lilithye 才是能赚钱的一方:B09VGJJ8NY、B09F6L97Q7、B0BBFXXCTQ 分别有17.15%、17.18%、16.14%利润率,月销700/600/600,约34xx评价,说明这个类目里要站稳,靠的是老品牌资源、稳定供应链和长期投放能力。更关键的是,市场里有明显的“赢家通吃”信号:Lilithye 这类老品牌的成熟款是稳定盈利样板,而新品牌没有任何真正的小商家成功案例;按你要求的标准,300评价/年以下的真实小卖成功样本在这批数据里没有出现,意味着小卖家不是难做,而是几乎没有可复制的成功路径。
结论很明确:不建议继续做。 如果你是大品牌,唯一能参考的是 Lilithye 的成熟款 B09VGJJ8NY / B09F6L97Q7 / B0BBFXXCTQ,但这意味着你得准备更高的品牌预算、投放预算和长期耐亏损能力;如果你是小商家,这个类目没有可验证的低成本成功案例,且新品牌新品成功率为0%,不应进入。
Early sourcing + logistics + marketing budget (USD)N/AExplains the budgetWith all these investments, who has profitable new releases
How many new listings are released by old brands?50.00%New listing success rate (old brands):0.00%New listing success rate (new brands):0.00%Alternatives- 床边小推车/窄缝收纳车:比悬挂式床边袋更便宜、可移动,适合放手机、书、水杯,且不依赖床栏或安装条件。
- 床头夹式阅读灯自带收纳底座:很多用户买床边caddy是为了解决睡前取物,夹式灯+小底座可同时满足照明和少量收纳,成本通常更低。
- 床栏夹式手机/遥控器收纳夹:更轻量,专门解决高频小物件收纳,不需要大容量和多口袋设计,价格也更低。
- 床边收纳篮/布艺筐:直接放在地面、床头柜或床边,比挂袋更通用,安装零门槛,适合租房、宿舍、病房等临时场景。
- 可拆式床头套袋/沙发扶手收纳袋:同样是软性收纳,但可挂在更多家具上,适配面更广,用户不一定需要专门的床边产品。
- 磁吸式/夹式小收纳盒:如果床架是金属或有合适边缘,小收纳盒比完整床边袋更简单,尤其适合只收纳手机、眼镜、遥控器的轻需求用户。
Alternative solutions may pose a risk to your investment in certain markets.
#Brands Investment Analysis
Listing这个市场不值得进入,已经明显拥挤,而且新品牌几乎没有成功样本。 现有数据里,新品牌新上架产品盈利率是0%,整体可识别盈利率只有21.43%,而新上架产品里可见的非盈利率是100%;同时市场总样本收入约16.46万美元,赚钱主要集中在老品牌,说明这是一个强竞争、低容错的市场。
证据非常直接:Lifewit 作为新入场品牌,5个已上架新产品全部不盈利,像 B0G4Z7PXPZ、B0G4ZJDBHV、B0H2DNX481 都没有跑出利润;Fab totes 也是新品牌,3个新产品里 0 个盈利,其中 B0GWQMDLLR 只有 3.74% 利润率,B0GWQMN92J 甚至是 -4.55%。这已经不是“还有机会”,而是典型价格战和试错失败市场。反过来看,真正赚钱的案例几乎都来自老品牌:Lilithye 的 B09DKPYXWH 利润率 10.24%、月收入 7776 美元;B09F6L97Q7 利润率 17.18%、月收入 8826 美元;B09VGJJ8NY 利润率 17.15%、月收入 10269 美元;BlissTotes 的 B0CYLC714P 也有 15.23% 利润率、月收入 15230 美元。它们不是小卖家的成功样本,都是成熟品牌靠结构加固、稳定性和品牌认知在吃市场。
如果硬要做,只有两条路,但都不适合小卖家:大品牌要跟 Lilithye / Surblue / BlissTotes 学,重点抄“金属框加固、双侧可调绑带、稳定不塌陷、床边高频收纳”的产品逻辑,优先参考 B09DKPYXWH、B0H2KSWY98、B0H2KVNS34;小卖家则没有真正的低风险成功案例可抄,因为可见的新品牌样本里没有一个达到“<300 reviews/year 的真实小卖家成功”标准,反而更像必须靠强投放、强促销甚至偏激进打法才能抢到一点流量。结论很简单:不要进入**。
Least investment in new productsMost investment in new productsNew products with Highest revenueLifewit
 Recent Monthly Revenue (USD):-(-)B0G4Z7PXPZ (4.1/5 (41 Reviews))Brand is a new entry in this marketNew ReleaseInsufficient Sales to Meet MOQUnderperformingNot enough sales volume to meet 100 MOQ
 Recent Monthly Revenue (USD):-(-)B0H2DNX481Brand is a new entry in this marketNew ReleaseInsufficient Sales to Meet MOQUnderperformingNot enough sales volume to meet 100 MOQRecent Monthly Revenue (USD):$515.00(50pcs/month)B0G4ZJDBHV (4/5 (43 Reviews))Brand is a new entry in this marketNew ReleaseInsufficient Sales to Meet MOQUnderperformingNot enough sales volume to meet 100 MOQOld brand with the most profitable new products
Lilithye
 Recent Monthly Revenue (USD):$10,269.00(700pcs/month)B09VGJJ8NY (4.4/5 (3441 Reviews))Brand is an old entry in this marketOld ReleaseSufficient Sales to Meet MOQOld ReleaseThis listing is deemed profitable
 Recent Monthly Revenue (USD):$8,826.00(600pcs/month)B09F6L97Q7 (4.4/5 (3451 Reviews))Brand is an old entry in this marketOld ReleaseSufficient Sales to Meet MOQOld ReleaseThis listing is deemed profitableRecent Monthly Revenue (USD):$8,562.00(600pcs/month)B0BBFXXCTQ (4.4/5 (3445 Reviews))Brand is an old entry in this marketOld ReleaseSufficient Sales to Meet MOQOld ReleaseThis listing is deemed profitableLeast profitable new products
Fab totes
 Recent Monthly Revenue (USD):-(-)B0GWQMDLLR (4.6/5 (18 Reviews))Brand is a new entry in this marketNew ReleaseInsufficient Sales to Meet MOQUnderperformingNot enough sales volume to meet 100 MOQ
 Recent Monthly Revenue (USD):-(-)B0H98WTM7GBrand is a new entry in this marketNew ReleaseInsufficient Sales to Meet MOQUnderperformingNot enough sales volume to meet 100 MOQRecent Monthly Revenue (USD):$1,189.00(100pcs/month)B0GWQMN92J (4.6/5 (23 Reviews))Brand is a new entry in this marketNew ReleaseSufficient Sales to Meet MOQWhite HatNet profit margin below 10.00%
#Differentiations
Unique productsCommon productsDifferentiation:- 浅粉色更有装饰感,图片更容易吸引宿舍用户
- |
- 床边收纳袋中外观区分明显,和黑色/蓝色款差异大
- |
- 双侧绑带+金属框,视觉上更挺括,适合想要好看又实用的人群
B0BBFXXCTQ (4.4/5 (3445 Reviews))Brand is an old entry in this marketOld ReleaseSufficient Sales to Meet MOQOld ReleaseThis listing is deemed profitableSales & BSR
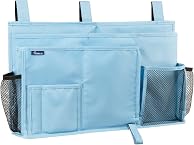
Differentiation:- 大号8口袋布局,和小号款在尺寸与功能上差异最明显
- |
- 天空蓝配色清爽,图片辨识度高,较容易被点击
- |
- 更适合需要大容量床边收纳的宿舍/病床用户
B087BWRP17 (4.5/5 (7297 Reviews))Brand is an old entry in this marketOld ReleaseSufficient Sales to Meet MOQOld ReleaseNet profit margin below 10.00%Sales & BSR
#Net Profit Margins: All vs New
Listing这个市场不值得进入,结论很明确:已进入低利润价格战,而且新品牌没有真正跑通。 新品牌新发布产品盈利率为0%,新产品利润分布里只有18.75%落在10%-20%区间,18.75%在0%-10%,还有18.75%是负利润;整体可识别利润产品也只有21.43%,这说明不是“能不能做”,而是“做了大概率也赚不到钱”。
证据很直接:Lifewit 作为新入场品牌,5个新产品全部非盈利,品牌新产品盈利率0%,但它还拿到了192,000的月收入、8,800件月销量,说明想靠常规打法挤进来,必须先吃下不赚钱的流量和投放;Fab totes 也是新入场,3个新产品全部非盈利,其中 B0GWQMN92J 只有-4.55%利润率、每月100件、B0GWQMDLLR 只有3.74%利润率,根本不是健康新品牌案例。反过来看,真正赚钱的产品几乎都被老品牌拿走:Lilithye 的 B09VGJJ8NY、B09F6L97Q7、B0BBFXXCTQ 分别做到17.15%、17.18%、16.14%利润率,且月销量700/600/600;Surblue 的 B087C29R69、B087C1VHXT、B087C2G4JR 也在13.77%-16.6%之间。市场趋势也不友好:2026年新发布集中爆发,但全部显示为非盈利,新品牌进入不是“增长”,而是“拥挤”。
给你的判断:大品牌不建议进,小生意更不建议进。 这个市场已经有明显的老品牌壁垒,且新品牌要么靠亏损换量,要么靠高投放硬推;没有看到<300 reviews/year的真正小生意成功样本,反而看到大量“新品牌非盈利、老品牌继续吃利润”的结构。若你要找可复制案例,只能跟老品牌学产品形态和定价,但这不代表你能靠小预算复制成功。
Profitability difficultyModerate Risk Due to Price CompetitionAll products distribution on different profit levels
All products profit ratio distribution, including all products. For products with insufficient sales or missing profit ratio data, they will be categorized into other rows. This distribution included products that cannot determine the release date.
x < -10.0%-10.0% <= x < 0.0%0.0% <= x < 10.0%10.0% <= x < 20.0%20.0% <= x < 30.0%30.0% <= x < 40.0%x >= 40.0%otherNew products distribution on different profit levels
This are the profit ratios of all new products. There are products without sufficient sales, no more than 100pcs in 3 months, or no profit ratio data, or just released. Those will be considered as 'other'
x < -10.0%-10.0% <= x < 0.0%0.0% <= x < 10.0%10.0% <= x < 20.0%20.0% <= x < 30.0%30.0% <= x < 40.0%x >= 40.0%other#Top Products by Net Profit Margin
Top 20 Profitable Products
Most profitable products ranked by profit value. Only includes products with positive profitability and active sales, regardless of release date.
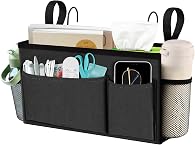 B0CYLC714PBlissTotes2024-06-10Yes$15.231000pcs$15230.014.35%$2185.51B09VGJJ8NYLilithye2021-08-25Yes$14.67700pcs$10269.017.15%$1761.14B09F6L97Q7Lilithye2021-08-25Yes$14.71600pcs$8826.017.18%$1516.31B0BBFXXCTQLilithye2022-08-22Yes$14.27600pcs$8562.016.14%$1381.91B09DKPYXWHLilithye2021-08-26Yes$12.96600pcs$7776.012.6%$979.78
 B087C29R69Surblue2020-05-04Yes$14.79200pcs$2958.013.77%$407.32
 B0H2KSWY98Lilithye2022-08-22Yes$12.96200pcs$2592.012.41%$321.67
 B087C1VHXTSurblue2020-05-05Yes$15.88100pcs$1588.016.6%$263.61
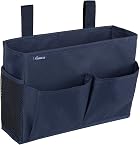 B087C2G4JRSurblue2020-05-04Yes$14.65100pcs$1465.014.45%$211.7
 B0H2KVNS34Lilithye2022-08-22Yes$12.96100pcs$1296.012.54%$162.52
 B0CYLHMNZLBlissTotes2024-06-10Yes$16.1650pcs$808.016.47%$133.08
 B087BXSZXGSurblue2019-05-10Yes$16.9150pcs$845.514.14%$119.56
 B09PH99WRTSurblue2019-05-10Yes$14.6650pcs$733.014.39%$105.48
 B09PH8NTL5Surblue2019-05-10Yes$14.6550pcs$732.514.23%$104.24
 B09PH7LLXRSurblue2019-05-10Yes$14.6450pcs$732.013.83%$101.24
Top 20 Non-Profitable New Products
New products with negative profitability ranked by lowest profit value. Only includes newly released products classified as non-profitable.
B0GWQMN92JFab totes2026-04-10No$11.89100pcs$1189.0-4.55%$-54.09 B0G4ZFC81TLifewit2026-05-13No$8.9100pcs$890.0-5.35%$-47.61
 B0G4ZHWP33Lifewit2026-05-21No$10.350pcs$515.0-3.29%$-16.94B0G4ZJDBHVLifewit2026-05-21No$10.350pcs$515.011.75%$60.52B0G4Z7PXPZLifewit2026-05-26No$13.36-pcs$-12.51%$-
 B0GGQGXSYGSurblue2026-01-14No$18.33-pcs$-18.83%$-
 B0GGQLSKRBSurblue2026-01-14No$19.5-pcs$-5.98%$-
 B0GGQ7QFBLSurblue2026-01-14No$16.19-pcs$-14.1%$-
 B0GGQMDN7DSurblue2026-01-14No$19.21-pcs$-20.01%$-
 B0GGQMMBQJSurblue2026-01-14No$16.58-pcs$-14.98%$-B0GWQMDLLRFab totes2026-04-10No$15.09-pcs$-3.74%$-
 B0GGQJ33BGSurblue2026-01-14No$18.69-pcs$-7.54%$-
 B0GGQP6XNQSurblue2026-01-14No$16.75-pcs$-15.35%$-
 B0GGQH7WDXSurblue2026-01-14No$18.53-pcs$-10.4%$-B0H2DNX481Lifewit2026-03-14No$--pcs$--%$-B0H98WTM7GFab totes2026-04-10No$--pcs$--%$-
#New Product Success Rates
Listing这个市场不值得进入,已经接近价格战和过度拥挤:新品牌里没有任何新发布产品跑出盈利,整体新发布盈利率是0%,而新发布产品的利润率分布也几乎都卡在低位,典型是低利润、低成功率市场。 这不是“可优化后再进”的市场,而是现在就应该回避的市场;无论大品牌还是小品牌,贸然进入都很难赚到钱。
New products success rate.
What is the ratio of profitable products
Profitable (Unidentifiable released date)Profitable (Old product)Profitable (New product)Profitable (New product on old listing)New products but non profitableNo data availableNonprofitable new products divide by brands
What is the ratio of different brands owning all nonprofitable new products
SurblueLifewitFab totes#Success Rate by Entry Time
Listing这个市场不值得进入,结论很明确:已进入价格战/饱和风险区,新品牌几乎没有真实成功样本。 近一年新上架16个产品里,盈利率是0%,而且最近新品牌的表现是8个新上架全部不盈利;同时老品牌 Surblue 也只有16.28%成功率,说明这不是“新手可轻松切入”的市场,而是需要持续烧钱和强运营才能勉强站住的市场。
How many products released each year
Y-axis is product counts. X-axis is time period. For each time period, there are 2 column, each column is a released type of a product. Columns are in following orders: New product, New product on old listing
How many products released each month
Y-axis is product counts. X-axis is time period. For each time period, there are 2 column, each column is a released type of a product. Columns are in following orders: New product, New product on old listing
#Net Profit Margins by Entry Time
Different profit ratios of products released in year
Header is the profit ratios and first column is different time period. Each cells includes how many products are relased at the specific timerange and has a corresponding profit ratios. Only profitable and with active sales (more than 100 pcs in 3 months) will be considered. Any products without sufficient sold units in 3 months will be marked as 'other'.
Time/Profit% x < -10.0% -10.0% <= x < 0.0% 0.0% <= x < 10.0% 10.0% <= x < 20.0% 20.0% <= x < 30.0% 30.0% <= x < 40.0% x >= 40.0% other 2022 0 0 0 0 0 0 0 0 2023 0 0 0 0 0 0 0 0 2024 0 0 0 0 0 0 0 0 2025 0 0 0 0 0 0 0 0 2026 0 2 0 0 0 0 0 14 ≥ 10% Profitable< 10% UnprofitableUnidentifiableDifferent profit ratios of products released in month
Header is the profit ratios and first column is different time period. Each cells includes how many products are relased at the specific timerange and has a corresponding profit ratios. Only profitable and with active sales (more than 100 pcs in 3 months) will be considered. Any products without sufficient sold units in 3 months will be marked as 'other'.
Time/Profit% x < -10.0% -10.0% <= x < 0.0% 0.0% <= x < 10.0% 10.0% <= x < 20.0% 20.0% <= x < 30.0% 30.0% <= x < 40.0% x >= 40.0% other 2025/7 0 0 0 0 0 0 0 0 2025/8 0 0 0 0 0 0 0 0 2025/9 0 0 0 0 0 0 0 0 2025/10 0 0 0 0 0 0 0 0 2025/11 0 0 0 0 0 0 0 0 2025/12 0 0 0 0 0 0 0 0 2026/1 0 0 0 0 0 0 0 8 2026/2 0 0 0 0 0 0 0 0 2026/3 0 0 0 0 0 0 0 1 2026/4 0 1 0 0 0 0 0 2 2026/5 0 1 0 0 0 0 0 3 2026/6 0 0 0 0 0 0 0 0 ≥ 10% Profitable< 10% UnprofitableUnidentifiable#Case Study
Success CasesSurblue Bedside Caddy Hanging Bed Organizer Storage Bag Pocket for Bunk and Hospital Beds, College Dorm Rooms Baby Bed Rails,Camp 4 Pockets and 2 Hooks (Gray)
This listing is deemed profitablePrice (USD)$15.88Released TypeOld Release (2020-05-05)Brand is an old entry in this marketSize and Weight29.3 x 20.6 x 3.4 cm, 200.00gProfitable Factors
Based on old ASINDesign & Appearance
灰色更适合宿舍、医院和中性家居场景,接受度高, 悬挂式床边收纳袋,4个口袋+2个挂钩的经典结构,属于成熟通用款Key Buying Motive
基于旧ASIN延续的成熟款式,主打免安装、可固定床栏、承重支撑和多口袋收纳Target Customers
面向宿舍上铺、双层床、医院病床和婴儿床栏等需要床边随手收纳的人群Early Investment
Investment
Monthly Revenue (Recent) (USD)$1,588.00100 sold in the past 30 days · as of 2026年7月Net Profit Margin
Sea Freight12.55% / 16.60%Peak / Non PeakRail Freight- / -Peak / Non PeakAir Freight2.04% / 6.08%Peak / Non PeakSales & BSR Performance
Surblue Caddy Hanging Organizer Bedside Storage Bag for Bunk and Hospital Beds, Black, Small
This listing is deemed profitablePrice (USD)$14.79Released TypeOld Release (2020-05-04)Brand is an old entry in this marketSize and Weight29.6 x 20.5 x 3.5 cm, 240.00gProfitable Factors
Based on old ASINDistinct functions and featuresDesign & Appearance
黑色款在同类产品中更偏向简洁、百搭和耐脏定位, 标准床边挂袋结构,带多口袋与2个挂钩,属于成熟通用设计Key Buying Motive
2个魔术贴绑带固定+背板支撑,强调稳固承重;4口袋+2挂钩满足床边高频收纳Target Customers
宿舍上铺/双层床用户、医院病床陪护、需要床边高频触手可及收纳的人群Early Investment
Investment
Monthly Revenue (Recent) (USD)$2,958.00200 sold in the past 30 days · as of 2026年7月Net Profit Margin
Sea Freight9.34% / 13.77%Peak / Non PeakRail Freight- / -Peak / Non PeakAir Freight-2.34% / 2.09%Peak / Non PeakSales & BSR Performance
Loading samples... 20%