
- Benchmark ASINB0GV45RBM2
- MarketplaceUS
- Category ID1055398
- Analyzed Products
- Keywordportable air conditioner, portable ac unit, room air conditioner
- Price Range-
- Minimum Net Profit Margin10.00%
- MOQ100
- Est. Purchasing CostNo price data
- Data Date2026-07-30
- Your Budget (for new listing) (CNY)¥500,000.00
Report summary from Keble AI Agent: Listing
结论很直接:这个市场不值得进入,已经是明显的过度拥挤,而且正在走向价格战。 新品牌近一年已经有22个,新增新品87个,按你的标准这不是早期蓝海,而是成熟拥挤赛道;新品牌新品盈利率只有34.48%,看起来不算低,但非盈利新品有41个、亏损/不赚钱的新品有57.63%,而且最近6月新品里是5个赚钱对21个亏钱,趋势在恶化。
Recommended Products Features Direction
These products have successfully captured market share and are profitable. Their design and features are suggested for your investment, based on market competition, saturation, and demand.
New Brands
VS
Old Brands
Green indicates better success rate, red indicates poorer success rate. If you are a new brand, focus on the left side; if you are an old brand, focus on the right side.
New Brands
Old Brands
#Budget Requirement
Listing结论很明确:这个市场不适合进入。 新品牌新发布产品盈利率只有34.48%,亏损率高达47.13%,而且样本里已经出现大量新品牌涌入,明显处在竞争过热、靠价格和投放硬拼的状态;用户50万人民币预算可以做一个单品的前期入场,但不足以支撑长期研发、品牌和认证消耗,进场风险很高。
Early sourcing + logistics + marketing budget (USD)$28,486.79 - $408,308.16Explains the budgetWith all these investments, who has profitable new releases
How many new listings are released by old brands?42.00%New listing success rate (old brands):31.75%New listing success rate (new brands):34.48%Which new brands have these successful new listings?...Which old brands have these successful new listings?...Other major expensesR&DAlternatives- 便携式蒸发冷风机(移动冷风扇)
- 落地/塔式循环风扇 + 冰晶盒/冰袋
- 窗式空调(中低BTU入门机型)
- 迷你除湿机(偏湿热环境先降湿再配风扇)
- 便携式冷风机/个人桌面冷却器(只覆盖局部区域)
Alternative solutions may pose a risk to your investment in certain markets.
#Brands Investment Analysis
Listing这个市场不适合现在进入。 新品牌在近一年里已经有22个,按你给的标准已经接近/达到过度拥挤;更关键的是,新上架产品整体成功率只有33.33%,但新品牌新款的盈利率只有34.48%,失败率高达47.13%,而且最新一批在6月的表现已经是5个赚钱、21个亏钱,明显在往更激烈的价格战走。
大品牌可以看的标杆是 BLACK+DECKER、Midea、DREO,但这不是“容易复制”的机会,而是要砸钱硬打的赛道。 BLACK+DECKER 的 B01DLPUWL2 价格约 370.35 美元,利润率 20.48%,月销约 7000;B01DLPUWHQ 价格约 548.64 美元,利润率 25.76%,月销约 2000;B01DLPUWJ4 价格约 524.08 美元,利润率 28.04%,月销约 900。它们靠的是高客单、成熟品牌力和长期信任,不是单靠低价。按单个 ASIN 的进入预算看,ZAFRO 这类成功款里,B0GRGFVYFP 约 387,114.72 元,B0GJZKWRCG 约 45,579 美元,B0GJZDZD41 约 51,473 美元;你当前预算 50 万元 CNY 只能勉强覆盖这类单品的前期投入,长期品牌、研发和认证成本还没算进去。小品牌真正可参考的“成功样本”只有少数:ZAFRO 的 B0GJZDZD41 利润率 24.59%,最新评价 682;B0GJZKWRCG 利润率 21.66%,673 条评价;YLEOOB 的 B0GVPFN4YK 利润率 22.41%,554 条评价、单品预算约 53,604.63 元。它们能跑出来,核心是把功能做得更全:APP/遥控、静音、节能、双风道/大空间覆盖,而且价格带明显高于失败款。
New products with Highest revenueMost investment in new productsZAFRO
 Recent Monthly Revenue (USD):$1,544,190.00(3000pcs/month)B0GJZDZD41 (4.3/5 (682 Reviews))Brand is a new entry in this marketNew ReleaseSufficient Sales to Meet MOQWhite HatThis listing is deemed profitableRecent Monthly Revenue (USD):$455,790.00(1000pcs/month)B0GJZKWRCG (4.3/5 (673 Reviews))Brand is a new entry in this marketNew ReleaseSufficient Sales to Meet MOQWhite HatThis listing is deemed profitableRecent Monthly Revenue (USD):$454,784.00(800pcs/month)B0GRGFVYFP (4.3/5 (613 Reviews))Brand is a new entry in this marketNew ReleaseSufficient Sales to Meet MOQWhite HatThis listing is deemed profitableOld brand with the most profitable new products
BLACK+DECKER
 Recent Monthly Revenue (USD):$2,592,450.00(7000pcs/month)B01DLPUWL2 (4/5 (16150 Reviews))Brand is an old entry in this marketOld ReleaseSufficient Sales to Meet MOQOld ReleaseThis listing is deemed profitable
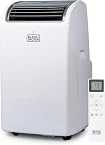 Recent Monthly Revenue (USD):$1,097,280.00(2000pcs/month)B01DLPUWHQ (3.9/5 (9059 Reviews))Brand is an old entry in this marketOld ReleaseSufficient Sales to Meet MOQOld ReleaseThis listing is deemed profitable
 Recent Monthly Revenue (USD):$471,672.00(900pcs/month)B01DLPUWJ4 (4/5 (6037 Reviews))Brand is an old entry in this marketOld ReleaseSufficient Sales to Meet MOQOld ReleaseThis listing is deemed profitableLeast investment in new products
YLEOOB
Recent Monthly Revenue (USD):$168,111.00(450pcs/month)B0GVPFN4YK (4.3/5 (554 Reviews))Brand is a new entry in this marketNew ReleaseSufficient Sales to Meet MOQBlack HatThis listing is deemed profitableLeast profitable new productskukoyacs
Recent Monthly Revenue (USD):-(-)B0H6SJQRWS (4/5 (23 Reviews))Brand is a new entry in this marketNew ReleaseInsufficient Sales to Meet MOQUnderperformingNot enough sales volume to meet 100 MOQ#Differentiations
Unique productsCommon productsDifferentiation:- 上出风口+双软管外观辨识度高
- |
- 16000 BTU,大空间卖点更突出
- |
- 适合卧室/公寓,静音与夜间使用诉求强
B0GJRJ57YX (4.5/5 (272 Reviews))Brand is a new entry in this marketNew ReleaseSufficient Sales to Meet MOQWhite HatThis listing is deemed profitableSales & BSR
Differentiation:- 双管一体式外观,与常见单管机型差异大
- |
- 带制热功能,四季使用场景更独特
- |
- 高端家电感强,适合重视静音与省电用户
B0FC2SGGF9 (3.9/5 (181 Reviews))Brand is an old entry in this marketOld ReleaseSufficient Sales to Meet MOQOld ReleaseThis listing is deemed profitableSales & BSR
#Net Profit Margins: All vs New
Listing这个市场不适合进入,已经明显偏向价格战和过度拥挤。 新品利润分布里,已知利润率低于10%的产品占了23.96%,而10%~20%只占24.67%,高利润并不占主流;更关键的是,新品牌新品里真正盈利的只占34.48%,未盈利的达到47.13%,说明大多数新玩家进来都在亏或接近亏。
Profitability difficultyModerate Risk Due to Price CompetitionAll products distribution on different profit levels
All products profit ratio distribution, including all products. For products with insufficient sales or missing profit ratio data, they will be categorized into other rows. This distribution included products that cannot determine the release date.
x < -10.0%-10.0% <= x < 0.0%0.0% <= x < 10.0%10.0% <= x < 20.0%20.0% <= x < 30.0%30.0% <= x < 40.0%x >= 40.0%otherNew products distribution on different profit levels
This are the profit ratios of all new products. There are products without sufficient sales, no more than 100pcs in 3 months, or no profit ratio data, or just released. Those will be considered as 'other'
x < -10.0%-10.0% <= x < 0.0%0.0% <= x < 10.0%10.0% <= x < 20.0%20.0% <= x < 30.0%30.0% <= x < 40.0%x >= 40.0%other#Top Products by Net Profit Margin
Top 20 Profitable Products
Most profitable products ranked by profit value. Only includes products with positive profitability and active sales, regardless of release date.
B01DLPUWL2BLACK+DECKER2016-03-29Yes$370.357000pcs$2592450.020.48%$530933.76B0GJZDZD41ZAFRO2026-01-27Yes$514.733000pcs$1544190.024.59%$379716.33B0GQLZ14QHKoolSiln2026-03-18Yes$501.553000pcs$1504650.023.42%$352389.03B01DLPUWHQBLACK+DECKER2016-03-29Yes$548.642000pcs$1097280.025.76%$282659.33 B0DYDRXDG3DREO2025-02-23Yes$416.083000pcs$1248240.021.49%$268246.78
 B0F3HRSN8BDREO2025-04-02Yes$494.042000pcs$988080.017.76%$175483.01
 B0D3XJW54KCoolblus2024-05-11Yes$277.214000pcs$1108840.014.4%$159672.96B0CM1YH26WHUMHOLD2023-10-29Yes$420.652000pcs$841300.018.29%$153873.77B0GV45RBM2Midea2026-03-27Yes$616.341000pcs$616340.022.27%$137258.92B01DLPUWJ4BLACK+DECKER2016-03-29Yes$524.08900pcs$471672.028.04%$132256.83B0GRGFVYFPZAFRO2026-03-06Yes$568.48800pcs$454784.027.49%$125020.13
 B0GZ4TJF9YSNOCOD2026-04-30Yes$439.561000pcs$439560.027.65%$121538.35B0FC2SGGF9Midea2025-06-05Yes$641.43800pcs$513144.023.14%$118741.53
 B0F48NKGTKDREO2025-04-01Yes$584.04800pcs$467232.024.68%$115312.86B0CS9YVXH1Gasbye2024-02-29Yes$575.5800pcs$460400.023.41%$107779.64B0GJZKWRCGZAFRO2026-01-27Yes$455.791000pcs$455790.021.66%$98724.12B01DLPUWG2BLACK+DECKER2016-03-29Yes$438.41800pcs$350728.028.0%$98203.85B0GV3XFJPXMidea2026-03-27Yes$546.02900pcs$491418.017.32%$85113.6B0GVDSCZ86TECXERLLON2026-03-30Yes$502.111000pcs$502110.016.83%$84505.12B0DQWXDDPZMidea2024-12-19Yes$516.1700pcs$361270.022.87%$82622.45
Top 20 Profitable New Products
Most profitable new products ranked by profit value. Only includes newly released products with positive profitability and active sales.
B0GJZDZD41ZAFRO2026-01-27Yes$514.733000pcs$1544190.024.59%$379716.33B0GQLZ14QHKoolSiln2026-03-18Yes$501.553000pcs$1504650.023.42%$352389.03B0GV45RBM2Midea2026-03-27Yes$616.341000pcs$616340.022.27%$137258.92B0GRGFVYFPZAFRO2026-03-06Yes$568.48800pcs$454784.027.49%$125020.13B0GZ4TJF9YSNOCOD2026-04-30Yes$439.561000pcs$439560.027.65%$121538.35B0GJZKWRCGZAFRO2026-01-27Yes$455.791000pcs$455790.021.66%$98724.12B0GV3XFJPXMidea2026-03-27Yes$546.02900pcs$491418.017.32%$85113.6B0GVDSCZ86TECXERLLON2026-03-30Yes$502.111000pcs$502110.016.83%$84505.12 B0GYDZR5RXMidea2026-04-24Yes$541.01800pcs$432808.016.41%$71023.8B0GKNLXHYFAGTANA2026-01-30Yes$554.87500pcs$277435.025.43%$70551.73B0GYDKSC94Midea2026-04-24Yes$568.4700pcs$397880.017.14%$68196.64B0H4ZZXPPKKoolSiln2026-06-12Yes$610.36400pcs$244144.024.48%$59766.46B0GRGRF949ZAFRO2026-03-06Yes$456.29600pcs$273774.021.67%$59326.83
 B0GN21V6RTMidea2026-02-12Yes$401.92900pcs$361728.016.14%$58382.9
 B0H3C2TQKQAGTANA2026-05-29Yes$579.49400pcs$231796.024.99%$57925.83
 B0FM3X2VHTHUMHOLD2025-08-12Yes$492.44500pcs$246220.021.27%$52371.0B0G527HYJXMidea2025-12-04Yes$366.45800pcs$293160.016.55%$48517.98B0GWMMGDFZGasbye2026-04-09Yes$507.85500pcs$253925.018.79%$47712.51
 B0GJDPK2KXftocase2026-05-01Yes$413.1500pcs$206550.020.25%$41826.38B0GQGJ6DMLDREO2026-02-27Yes$594.71350pcs$208148.519.94%$41504.82
#New Product Success Rates
Listing这个市场不适合现在进入,核心原因是已经接近价格战/高竞争区,新品牌并没有形成清晰的低门槛机会。整体新产品成功率只有33.33%,但失败率仍高达57.63%;更关键的是,老品牌新上新产品成功率只有42.55%,新品牌也只有42.25%,说明不是“新手友好型”市场,而是靠高投入、功能差异化和品牌力硬拼的市场。
New products success rate.
What is the ratio of profitable products
Profitable (Unidentifiable released date)Profitable (Old product)Profitable (New product)Profitable (New product on old listing)New products but non profitableProfitable new products divide by brands
What is the ratio of different brands owning all profitable new products
ZAFROMideaOtherNonprofitable new products divide by brands
What is the ratio of different brands owning all nonprofitable new products
GarveePeakPursuitOther#Success Rate by Entry Time
Listing结论很直接:这个市场不值得进入,已经接近拥挤并且在往价格战方向走。 今年新品牌涌入很猛,但利润并没有同步变好;新品牌里真正赚钱的只有42.25%,失败的有57.75%,最近一个月区间里非盈利新品还明显更多,说明竞争正在加速恶化。
证据很清楚。 按时间看,2026年新品牌新品数量暴增到46个,而非盈利新品有63个,净结果是亏损面更大;近几个月里,3月还是7个盈利对12个亏损,4月是9个盈利对11个亏损,6月更是5个盈利对21个亏损,走势是越新越难赚。新品中能跑出来的主要是大品牌和已建立优势品牌:ZAFRO拿到7个盈利ASIN,AGTANA和KoolSiln各4个,但ZAFRO也同时有4个非盈利ASIN;BLACK+DECKER这类老牌依然靠成熟款维持高收入,B01DLPUWL2月销7000、毛利20.48%,B01DLPUWHQ月销2000、毛利25.76%,说明这个类目更像是老品牌吃红利,新品牌要么靠大投入,要么靠强营销。更危险的是,kukoyacs 的 B0H6SJQRWS 只有23条评论却已经亏损5.04%,而 YLEOOB 的 B0GVPFN4YK 虽然做到22.41%利润率,但直接用了黑帽式新品推广,预算只有53604.63美元却还叠加了总投入130005.84美元,说明想复制这种成功,不只是你这500000 CNY预算能覆盖的,还可能需要额外的品牌和推广成本。
短结论:不要进。 对大品牌,这里也不是轻松市场,必须有更高预算和长期品牌投入;对小品牌,这不是可持续机会,尤其不适合靠正常打法切入。
How many products released each year
Y-axis is product counts. X-axis is time period. For each time period, there are 2 column, each column is a released type of a product. Columns are in following orders: New product, New product on old listing
How many products released each month
Y-axis is product counts. X-axis is time period. For each time period, there are 2 column, each column is a released type of a product. Columns are in following orders: New product, New product on old listing
#Net Profit Margins by Entry Time
Different profit ratios of products released in year
Header is the profit ratios and first column is different time period. Each cells includes how many products are relased at the specific timerange and has a corresponding profit ratios. Only profitable and with active sales (more than 100 pcs in 3 months) will be considered. Any products without sufficient sold units in 3 months will be marked as 'other'.
Time/Profit% x < -10.0% -10.0% <= x < 0.0% 0.0% <= x < 10.0% 10.0% <= x < 20.0% 20.0% <= x < 30.0% 30.0% <= x < 40.0% x >= 40.0% other 2022 0 0 0 0 0 0 0 0 2023 0 0 0 0 0 0 0 0 2024 0 0 0 0 0 0 0 0 2025 0 0 2 2 2 0 0 3 2026 0 3 12 24 21 1 0 80 ≥ 10% Profitable< 10% UnprofitableUnidentifiableDifferent profit ratios of products released in month
Header is the profit ratios and first column is different time period. Each cells includes how many products are relased at the specific timerange and has a corresponding profit ratios. Only profitable and with active sales (more than 100 pcs in 3 months) will be considered. Any products without sufficient sold units in 3 months will be marked as 'other'.
Time/Profit% x < -10.0% -10.0% <= x < 0.0% 0.0% <= x < 10.0% 10.0% <= x < 20.0% 20.0% <= x < 30.0% 30.0% <= x < 40.0% x >= 40.0% other 2025/7 0 0 0 0 0 0 0 0 2025/8 0 0 1 0 1 0 0 2 2025/9 0 0 0 0 0 0 0 0 2025/10 0 0 0 0 0 0 0 0 2025/11 0 0 0 0 0 0 0 0 2025/12 0 0 1 2 1 0 0 1 2026/1 0 0 2 5 3 0 0 0 2026/2 0 0 0 6 3 0 0 4 2026/3 0 1 2 2 5 0 0 9 2026/4 0 1 4 6 3 0 0 6 2026/5 0 0 1 4 4 0 0 7 2026/6 0 1 3 1 3 1 0 17 ≥ 10% Profitable< 10% UnprofitableUnidentifiable#Case Study
Success CasesBLACK+DECKERB01DLPUWG2 (4/5 (11005 Reviews))BLACK+DECKER Portable Air Conditioner, 10,000 BTU, BPACT10WT, White
This listing is deemed profitablePrice (USD)$438.41Released TypeOld Release (2016-03-29)Brand is an old entry in this marketSize and Weight64.8 x 45.7 x 43.2 cm, 21455.00gProfitable Factors
Established brand with longevityBased on old ASINDesign & Appearance
白色简洁外观,符合家电主流审美, 常规立式便携式一体机结构,属于市场通用设计Key Buying Motive
3合1功能(制冷/除湿/送风)+ 可移动滚轮 + 免复杂安装窗套件,满足卧室/小客厅快速降温需求Target Customers
面向需要中小空间快速降温、且更信任大品牌口碑与成熟老链接承接的家庭用户Early Investment
Investment
Monthly Revenue (Recent) (USD)$350,728.00800 sold in the past 30 days · as of 2026年7月Net Profit Margin
Sea Freight24.76% / 28.00%Peak / Non PeakRail Freight- / -Peak / Non PeakAir Freight0.91% / 4.15%Peak / Non PeakSales & BSR Performance

Humhold Inverter 16000BTU Portable Air Conditioners with Remote, Free Stand Cooling Portable AC Unit for Room up to 800 sq.ft, with Dehumidifier & Fan, Dual Hose, Quiet Sleep Mode(42dB), Windows Kit
This listing is deemed profitablePrice (USD)$555.82Released TypeNew Release (2026-04-23)Brand is an old entry in this marketSize and Weight88.9 x 47.0 x 43.2 cm, 27669.00gProfitable Factors
Based on old ASINDistinct functions and featuresDesign & Appearance
白色机身,顶部黑色面板,偏通用家电风格,没有明显差异化配色, 立式便携机身,圆角方柱造型,带脚轮和隐藏把手,属于主流公共模具风格Key Buying Motive
16000BTU高制冷量,双软管设计,搭配变频技术与42dB睡眠模式,主打大空间快速且更安静的制冷Target Customers
面向大户型客厅、卧室、出租房或办公室等需要覆盖600-800平方英尺空间、同时关注能效和静音体验的用户Early Investment
Investment
Monthly Revenue (Recent) (USD)$166,746.00300 sold in the past 30 days · as of 2026年7月Net Profit Margin
Sea Freight20.97% / 24.66%Peak / Non PeakRail Freight- / -Peak / Non PeakAir Freight-5.41% / -1.73%Peak / Non PeakSales & BSR Performance
Loading samples... 9%